Java性能测试利器 - JMH基准性能测试
背景:
在庞大的系统中进行开发,为了保证系统性能,我们通常会针对不同的维度进行性能测试,常见的测试方式如压测等,由于系统逐渐庞大,我们的测试粒度会响应的变小(从上到下进行测试成本较高,更多的时候我们需要针对下层的方法进行测试)。本次的主题将展开面向方法层级的性能测试,以保证可以从下而上的不断进行性能优化。
由于篇幅有限,本文只做大概索引,更多内容感兴趣的朋友可自行查阅。
基准性能测试
基准测试是指通过设计科学的测试方法、测试工具和测试系统,实现对一类测试对象的某项性能指标进行定量的和可对比的测试。
举个例子:
测试显卡性能:3DMark
JMH是什么
Java Microbenchmark Harness (JMH)
JMH is a Java harness for building, running, and analysing nano/micro/milli/macro benchmarks written in Java and other languages targeting the JVM. JMH 是一个 Java 工具,用于构建、运行和分析用 Java 和其他针对 JVM 的语言编写的纳米/微/毫/宏基准测试。
JMH由OpenJDK团队维护,官方于JDK1.9将JMH集成到了JDK中。
为什么需要使用JMH
Java的性能测试是比较难的,因为JVM越来越智能,平台会在不同的阶段帮助我们优化代码,经过JVM优化后的代码就会存在“失真”的问题,可能会导致实际的性能和真实运行时的测试结果差之毫厘。
我们常见的性能测试存在以下问题:
- 有时候发现程序越跑越快
- 代码调换下顺序每个阶段的性能就存在差距
- 缺少不同数量级下的量化指标
标准化测试工具带来以下好处
量化性能表现
基准测试通过可重复的实验,将代码的执行效率(如响应时间、吞吐量、内存占用等)转化为具体数值,避免了 “感觉更快” 或 “好像更慢” 这类主观判断,为性能优化提供客观依据。
验证优化效果
当对代码进行重构、算法改进或 JVM 参数调整时,基准测试能准确衡量优化前后的性能差异,判断优化是否真正有效,避免因盲目优化引入新问题。
揭示性能瓶颈
通过对比不同模块、不同实现方式的基准数据,可定位系统中的性能短板(如低效的集合操作、频繁的 GC、不合理的锁竞争等),指导开发者有针对性地进行优化。
保障代码质量
在持续集成流程中嵌入基准测试,能及时发现代码变更引入的性能退化,防止性能问题随着版本迭代逐渐累积,确保系统长期保持高效运行。
指导技术选型
面对多种实现方案(如不同的集合类、序列化框架、并发工具),基准测试可通过对比其在特定场景下的性能表现,帮助开发者选择最适合当前业务需求的技术方案。
JMH使用说明
先看一个例子🌰
e.g.
import org.openjdk.jmh.annotations.*;
import org.openjdk.jmh.runner.Runner;
import org.openjdk.jmh.runner.RunnerException;
import org.openjdk.jmh.runner.options.Options;
import org.openjdk.jmh.runner.options.OptionsBuilder;

import java.util.concurrent.TimeUnit;

@Warmup(iterations = 1, time = 1)
@Measurement(iterations = 5, time = 1)
@BenchmarkMode(Mode.Throughput)
@OutputTimeUnit(TimeUnit.SECONDS)
public class StringTest {


    @Benchmark
    public void stringTest() {
        String a = "";
        for (int i = 0; i < 1000; i++) {
            a += i;
        }
    }

    @Benchmark
    public void stringBuildTest() {
        StringBuilder a = new StringBuilder();
        for (int i = 0; i < 1000; i++) {
            a.append(i);
        }
    }


    public static void main(String[] args) throws RunnerException {
        Options options = new OptionsBuilder()
                .include(StringTest.class.getSimpleName())
                .forks(1)
                .build();

        new Runner(options).run();
    }
}
output
# JMH version: 1.37
# VM version: JDK 17.0.15, OpenJDK 64-Bit Server VM, 17.0.15+6
# VM invoker: D:\Program Files\Java\dragonwell-17.0.15.0.16+6-GA\bin\java.exe
# VM options: -javaagent:C:\Users\Yiwyn\AppData\Local\Programs\IntelliJ IDEA Ultimate\lib\idea_rt.jar=63813 -Dfile.encoding=UTF-8
# Blackhole mode: compiler (auto-detected, use -Djmh.blackhole.autoDetect=false to disable)
# Warmup: 1 iterations, 1 s each
# Measurement: 5 iterations, 1 s each
# Timeout: 10 min per iteration
# Threads: 1 thread, will synchronize iterations
# Benchmark mode: Throughput, ops/time
# Benchmark: com.yiwyn.example.StringTest.stringBuildTest

# Run progress: 0.00% complete, ETA 00:00:12
# Fork: 1 of 1
# Warmup Iteration   1: 183814.879 ops/s
Iteration   1: 174752.182 ops/s
Iteration   2: 180113.017 ops/s
Iteration   3: 179914.534 ops/s
Iteration   4: 178814.543 ops/s
Iteration   5: 179811.334 ops/s


Result "com.yiwyn.example.StringTest.stringBuildTest":
  178681.122 ±(99.9%) 8675.361 ops/s [Average]
  (min, avg, max) = (174752.182, 178681.122, 180113.017), stdev = 2252.964
  CI (99.9%): [170005.761, 187356.482] (assumes normal distribution)


# JMH version: 1.37
# VM version: JDK 17.0.15, OpenJDK 64-Bit Server VM, 17.0.15+6
# VM invoker: D:\Program Files\Java\dragonwell-17.0.15.0.16+6-GA\bin\java.exe
# VM options: -javaagent:C:\Users\Yiwyn\AppData\Local\Programs\IntelliJ IDEA Ultimate\lib\idea_rt.jar=63813 -Dfile.encoding=UTF-8
# Blackhole mode: compiler (auto-detected, use -Djmh.blackhole.autoDetect=false to disable)
# Warmup: 1 iterations, 1 s each
# Measurement: 5 iterations, 1 s each
# Timeout: 10 min per iteration
# Threads: 1 thread, will synchronize iterations
# Benchmark mode: Throughput, ops/time
# Benchmark: com.yiwyn.example.StringTest.stringTest

# Run progress: 50.00% complete, ETA 00:00:07
# Fork: 1 of 1
# Warmup Iteration   1: 6315.399 ops/s
Iteration   1: 7184.637 ops/s
Iteration   2: 7164.496 ops/s
Iteration   3: 6711.652 ops/s
Iteration   4: 7071.162 ops/s
Iteration   5: 7191.050 ops/s


Result "com.yiwyn.example.StringTest.stringTest":
  7064.599 ±(99.9%) 782.054 ops/s [Average]
  (min, avg, max) = (6711.652, 7064.599, 7191.050), stdev = 203.097
  CI (99.9%): [6282.546, 7846.653] (assumes normal distribution)


# Run complete. Total time: 00:00:14

REMEMBER: The numbers below are just data. To gain reusable insights, you need to follow up on
why the numbers are the way they are. Use profilers (see -prof, -lprof), design factorial
experiments, perform baseline and negative tests that provide experimental control, make sure
the benchmarking environment is safe on JVM/OS/HW level, ask for reviews from the domain experts.
Do not assume the numbers tell you what you want them to tell.

NOTE: Current JVM experimentally supports Compiler Blackholes, and they are in use. Please exercise
extra caution when trusting the results, look into the generated code to check the benchmark still
works, and factor in a small probability of new VM bugs. Additionally, while comparisons between
different JVMs are already problematic, the performance difference caused by different Blackhole
modes can be very significant. Please make sure you use the consistent Blackhole mode for comparisons.

Benchmark                    Mode  Cnt       Score      Error  Units
StringTest.stringBuildTest  thrpt    5  178681.122 ± 8675.361  ops/s
StringTest.stringTest       thrpt    5    7064.599 ±  782.054  ops/s
简单解释一下代码实例和输出结论
我们可以从代码中发现我们比较的是两种字符串拼接的效率,其中@BenchmarkMode(Mode.Throughput) 可以看出设计的测试模式是吞吐量(其他注解暂不做解释)
测试输出中,我们可以得到一些关键信息如 JVM信息、JMH配置信息、被测代码执行信息等。我们先关注最后的汇总数据
Benchmark(方法名)           Mode(模式)  Cnt(执行次数)    Score(分数)  Error(误差)  	Units(单位)
StringTest.stringBuildTest  thrpt    	5  			178681.122 ± 8675.361  		ops/s
StringTest.stringTest       thrpt    	5   		  7064.599 ±  782.054  		ops/s
从汇总信息看到,5次执行后,StringBuilder进行字符串拼接每秒执行178681次,其中误差8675次,String进行字符串拼接每秒执行7064次,其中误差782次。
从以后案例中,我们发现使用JMH进行性能测试有有以下好处:
- 易用性强
- 测试流程设计更科学
- 消除JVM优化干扰
- 统计显著性保障
详细说明
BenchmarkMode
在 JMH 中,@BenchmarkMode 注解用于指定基准测试的度量模式,不同模式关注代码性能的不同维度。以下是各模式的数据示例及结果好坏的判断标准
Mode.Throughput(吞吐量模式)
含义:单位时间内完成的操作次数(如次 / 秒),衡量代码的处理效率。 数据示例:
Benchmark         Mode  Cnt    Score   Error  Units
MyBenchmark.test  thrpt   20  567.324 ± 8.123  ops/s
表示平均每秒完成约 567 次操作,误差 ±8.123。 好坏判断: 数值越大越好。吞吐量越高,说明代码单位时间内处理的任务越多,效率越高。
Mode.AverageTime(平均时间模式)
含义:每次操作的平均耗时,衡量单次操作的平均效率。 数据示例:
Benchmark         Mode  Cnt    Score   Error  Units
MyBenchmark.test   avgt   20   1.762 ± 0.032  ms/op
表示每次操作平均耗时约 1.762 毫秒,误差 ±0.032 毫秒。 好坏判断: 数值越小越好。平均时间越短,说明单次操作的效率越高。
Mode.SampleTime(采样时间模式)
含义:随机采样部分操作的耗时,统计分布情况(如分位数),适合分析长尾延迟。 数据示例:
Benchmark         Mode  Cnt    Score   Error  Units
MyBenchmark.test  sample  100  95th=2.134  ms/op
MyBenchmark.test  sample  100  99th=3.567  ms/op
表示 95% 的操作耗时≤2.134 毫秒,99% 的操作耗时≤3.567 毫秒。 好坏判断: 分位数(如 95th、99th)数值越小越好,且分布越集中越好(说明延迟稳定性高,避免极端慢的操作)。
Mode.SingleShotTime(单次执行时间模式)
含义:测量单次操作的耗时(不重复执行),适合冷启动场景(如初始化操作)。 数据示例:
Benchmark         Mode  Cnt    Score   Error  Units
MyBenchmark.test  ss    10   45.213 ± 2.341  ms/op
表示单次操作平均耗时约 45.213 毫秒,误差 ±2.341 毫秒。 好坏判断: 数值越小越好,适合评估启动成本高的操作(如资源初始化)。
Mode.All(全模式)
含义:同时输出以上所有模式的结果,适合全面分析性能。 数据示例: 同时包含吞吐量、平均时间、采样时间、单次执行时间的统计数据。 总结:判断核心 吞吐量(Throughput):数值越大越好,关注 “效率”。 时间类(AverageTime、SampleTime、SingleShotTime):数值越小越好,关注 “速度” 或 “延迟”。 实际场景中需结合业务需求选择模式: 高并发任务优先看吞吐量; 低延迟要求(如接口响应)优先看平均时间或采样时间的分位数; 初始化操作看单次执行时间。
WarmUp
Warmup 是指在实际进行 Benchmark 前先进行预热的行为,所有的预热数据不会被纳入统计中。
触发 JIT 编译
因为 JVM 的 JIT(Java Intime Compiler,即时编译) 机制的存在,如果某个函数被调用多次之后,JVM 会尝试将其编译成为机器码从而提高执行速度。为了让 Benchmark 的结果更加接近真实情况就需要进行预热。
稳定内存布局
首次执行代码时,JVM 会进行类加载、对象初始化、内存分配等操作,这些操作会导致内存布局(如对象地址、缓存分布)不稳定。预热能让内存状态达到稳定(如对象进入老年代、缓存命中率趋于稳定),避免这些一次性开销影响测量结果。
消除系统波动
程序启动初期,系统资源(CPU、内存)可能被其他进程或 JVM 自身的初始化任务占用,预热过程可以 “平滑” 这些波动,让测量阶段的系统状态更稳定。
Measurement
度量,参数和WarmUp相同,所有的度量数据会被纳入到统计中。
⚠️ 这里需要注意一点,同时设置了 iterations 和 time , JMH会按照时间执行
例如: iterations = 1 time=10 , 被测试方法会执行10个时间单位,而不是执行一次迭代。若单位时间内执行不够iterations,很遗憾,测试依然会被直接终结。
Fork
在 JMH 中,@Fork注解用于控制基准测试的进程隔离行为,它决定了 JMH 会启动多少个独立的 JVM 进程来执行测试,以及每个进程的 JVM 参数配置。其核心作用是消除不同测试之间的干扰,确保结果的独立性和可靠性。
实战建议
- 默认推荐
@Fork(1):大多数场景下,1 个独立进程足以避免状态污染,且测试效率较高。 - 关键测试建议
@Fork(2)或更高:对于核心性能指标(如线上接口响应时间),多进程测试可以减少单次进程的偶然波动(如系统资源临时占用),让结果更可靠。 - 测试 JVM 参数时必须用
@Fork:不同 JVM 参数(如 GC 类型、堆大小)需要在独立进程中生效,否则参数冲突会导致测试无效。 - 避免过度 fork:
value值过大(如 > 5)会显著增加测试总耗时(每个进程都需重复预热和测量),需在可靠性和效率之间平衡。
总结
@Fork是 JMH 保障测试独立性的核心机制,通过进程隔离消除 JVM 状态污染,同时支持定制 JVM 参数以测试不同配置的性能。合理使用@Fork能大幅提升基准测试结果的可信度,尤其是在对比不同代码实现或 JVM 配置时。
State
在基准测试中,我们经常需要在测试方法之间共享数据(如输入参数、缓存对象等)。
@State的主要作用
- 定义数据的生命周期范围:指定共享数据在 “线程内”“跨线程” 还是 “跨测试组” 中有效。
- 自动管理状态初始化:JMH 会在测试开始前自动初始化带
@State注解的类,并在测试结束后自动清理。 - 支持多线程安全共享:通过不同的范围配置,确保多线程测试时数据访问的安全性(或故意引入竞争条件以测试并发性能)。
主要参数源代码:
public enum Scope {
    Benchmark, // 本次基准测试全局共享
    Group, // 组内数据共享 方法搭配@Group注解
    Thread; // 线程私有
}
总结
@State注解通过定义数据共享范围,解决 JMH 基准测试中的状态管理问题。
Scope.Thread:线程私有,无竞争,适合无状态测试。Scope.Benchmark:全局共享,有竞争,适合测试并发安全性和性能。Scope.Group:组内共享,用于关联操作的协同测试。
生态
数据报表
使用 resultFormat(ResultFormatType.JSON) api可输出统计文件
/**
	@see  org.openjdk.jmh.runner.options.ChainedOptionsBuilder#resultFormat
**/
public static void main(String[] args) throws RunnerException {
        Options opt = new OptionsBuilder()
                .include(Main.class.getSimpleName())
                .resultFormat(ResultFormatType.JSON)
                .result("./result.json") // 输出路径,可选项目
                .addProfiler(GCProfiler.class)
                .build();
        new Runner(opt).run();
    }
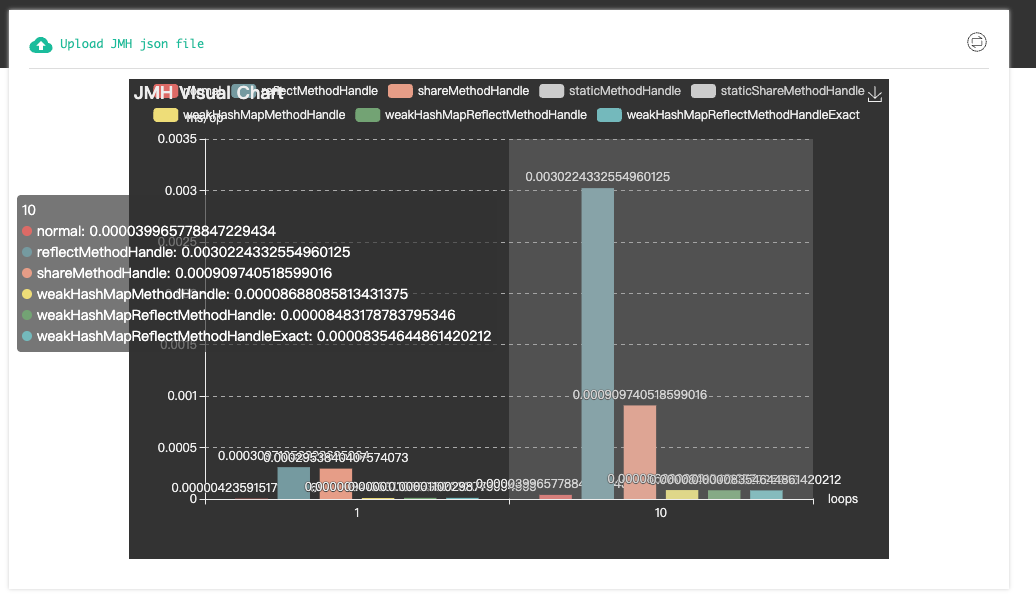
在得到统计文件后,可使用开源工具对文件进行可视化展示
扩展案例
在SpringTest中使用JMH
package com.yiwyn.jmh.service;

import com.yiwyn.jmh.JmhDemoApplication;
import org.junit.jupiter.api.Test;
import org.openjdk.jmh.annotations.*;
import org.openjdk.jmh.runner.Runner;
import org.openjdk.jmh.runner.RunnerException;
import org.openjdk.jmh.runner.options.Options;
import org.openjdk.jmh.runner.options.OptionsBuilder;
import org.springframework.beans.factory.annotation.Autowired;
import org.springframework.boot.SpringApplication;
import org.springframework.boot.test.context.SpringBootTest;
import org.springframework.context.ApplicationContext;
import org.springframework.context.ConfigurableApplicationContext;

import java.util.concurrent.TimeUnit;

import static org.junit.jupiter.api.Assertions.*;


@SpringBootTest
@Fork(1)
@BenchmarkMode(Mode.AverageTime)
@OutputTimeUnit(TimeUnit.NANOSECONDS)
@State(Scope.Thread)
@Warmup(iterations = 1, time = 1)
@Measurement(iterations = 2, time = 1)
public class TestServiceTest {


    private TestService testService;

    ConfigurableApplicationContext application;
    @Setup(Level.Trial)
    public void setup() {
        application = SpringApplication.run(JmhDemoApplication.class);

        testService = application.getBean(TestService.class);
    }

    @TearDown(Level.Trial)
    public void tearDown() {
        application.close();
    }


    @Benchmark
    public void joinString() {
        String s = testService.joinString(100);
        System.out.println(s);
    }

    public static void main(String[] args) throws RunnerException {
        Options options = new OptionsBuilder()
                .include(TestServiceTest.class.getSimpleName())
                .build();

        new Runner(options).run();
    }

}
Q:为什么要这么写@Setup @TearDown
A:因为测试方法joinString中调用的Bean是spring容器的,但是直接启动main方法是获取不到Spring容器的,为了获取到容器,我们使用setUp提前获取到spring容器,并且从Spring容器中获取需要使用的Bean。
@Setup(Level.Trial) 初始化全局资源 → 整个测试轮次使用 → @TearDown(Level.Trial) 释放全局资源
同一个方法多次调用对比
package com.yiwyn.example;

import org.openjdk.jmh.annotations.*;
import org.openjdk.jmh.results.format.ResultFormatType;
import org.openjdk.jmh.runner.Runner;
import org.openjdk.jmh.runner.RunnerException;
import org.openjdk.jmh.runner.options.Options;
import org.openjdk.jmh.runner.options.OptionsBuilder;

import java.util.concurrent.TimeUnit;

@BenchmarkMode(Mode.Throughput)
@OutputTimeUnit(TimeUnit.SECONDS)
@State(Scope.Benchmark)
@Warmup(iterations = 1, time = 1, timeUnit = TimeUnit.SECONDS)
@Measurement(iterations = 2, time = 1, timeUnit = TimeUnit.SECONDS)
@Fork(1)
public class ParamTest {


    @Param(value = {"1", "10", "100"})
    public Integer param;


    @Benchmark
    public String iterationTest() {

        String a = "";
        for (int i = 0; i < param; i++) {
            a += i;
        }
        return a;
    }


    public static void main(String[] args) throws RunnerException {
        Options options = new OptionsBuilder()
                .include(ParamTest.class.getSimpleName())
                .build();

        new Runner(options).run();
    }
}
@Param注解 可以定义每次iteration中使用不同的参数,用来测试同一个方法在不同数量级调用的结果。